What this article covers
- Defines Market Coverage as the patent family–level indicator that measures the size of the global market in which a patent family is active.
- Explains how Market Coverage is calculated using Gross National Income (GNI) values of active authorities, including the 0.7 discount factor applied to pending applications.
- Clarifies how EP and PCT applications are treated in the calculation and how nationalisation or validation affects Market Coverage over time.
- Describes how Market Coverage contributes to Competitive Impact and the Patent Asset Index (PAI) framework.
Introduction
Calculation of the Market Coverage for Pending Patent Applications
Calculation of the Market Coverage for EP and PCT Applications
Why It Matters
Related Articles
Introduction
Market Coverage is an indicator of the size of the global market in which a patent family is active, calculated at the patent family level using the gross national income (GNI) of each authority in which the family has at least one active member (including both in-force patents and pending applications). The GNI of the USA is represented by the value "1," with all other authorities represented relative to the USA as the world's largest economy. Market Coverage is the sum of the GNI-based values for every authority in which the family is active. For authorities where a family has only pending applications (no in-force patents), the representative GNI value is discounted by a factor of 0.7. GNI values are sourced from the
World Bank and
DGBAS (Taiwan's Bureau of Statistics), stated in US dollars at current prices, and updated yearly at the end of July.
The Market Coverage is calculated on the patent family level and serves as an indicator of the size of the global market in which the patent family is active. This indicator measures the size of the market in which a patent family is active as benchmarked against that of the USA. For example, a patent family that only has an in force member in the USA and no pending or in force members in any other authorities would have a Market Coverage of 1. Consequently, a Market Coverage of 2 would mean that the market in which the patent family is active is, in total, twice as large as the US market.
Calculation of the Market Coverage for Pending Patent Applications
The Market Coverage is calculated for all markets in which a patent family has at least one active member. The legal status "active" includes both in force members and pending members of a patent family.
To calculate the Market Coverage for pending patent applications, we use the same approach as for granted patents. However, we apply a discount factor of 0.7, since the global average probability of a pending application becoming a granted patent is 70%.
For example, a patent family that only includes a pending member in the USA and no pending or in force member in any other authority has a Market Coverage of 0.7 ( = 1 x 0.7).
Calculation of the Market Coverage for EP and PCT Applications
To calculate the Market Coverage for EP and PCT applications, we consider all possible authorities in which an EP or a PCT application can be validated or nationalized, respectively.
EP Applications
The market size for a pending EP application is calculated based on the aggregated GNI of all EPO member states (38 states as of July 2021). Here, too, the GNI of the USA serves as a proxy. The resulting value is then multiplied by the discount factor 0.7 (70%) for pending patent applications to obtain the Market Coverage.
The current Market Coverage of a patent family that only includes a pending EP application and no other active documents is 0.67 (as of July 2021). Please refer Unitary Patent & Unified Patent Court
Note: Once an EP application has been granted ("validated"), the legal status of the EP document at the EPO is set to "inactive", while the in force documents related to the authorities in which the EP application has been validated are set to "active". With that, the Market Coverage of EP application is replaced by the actual Market Coverage of the validated authorities.
PCT Applications
The market size for a pending PCT application is calculated based on the aggregated GNI of all PCT contracting states (153 states as of July 2021). Here, too, the GNI of the USA serves as a proxy. The resulting value is then multiplied by the discount factor 0.7 (70%)for pending patent applications to obtain the Market Coverage.
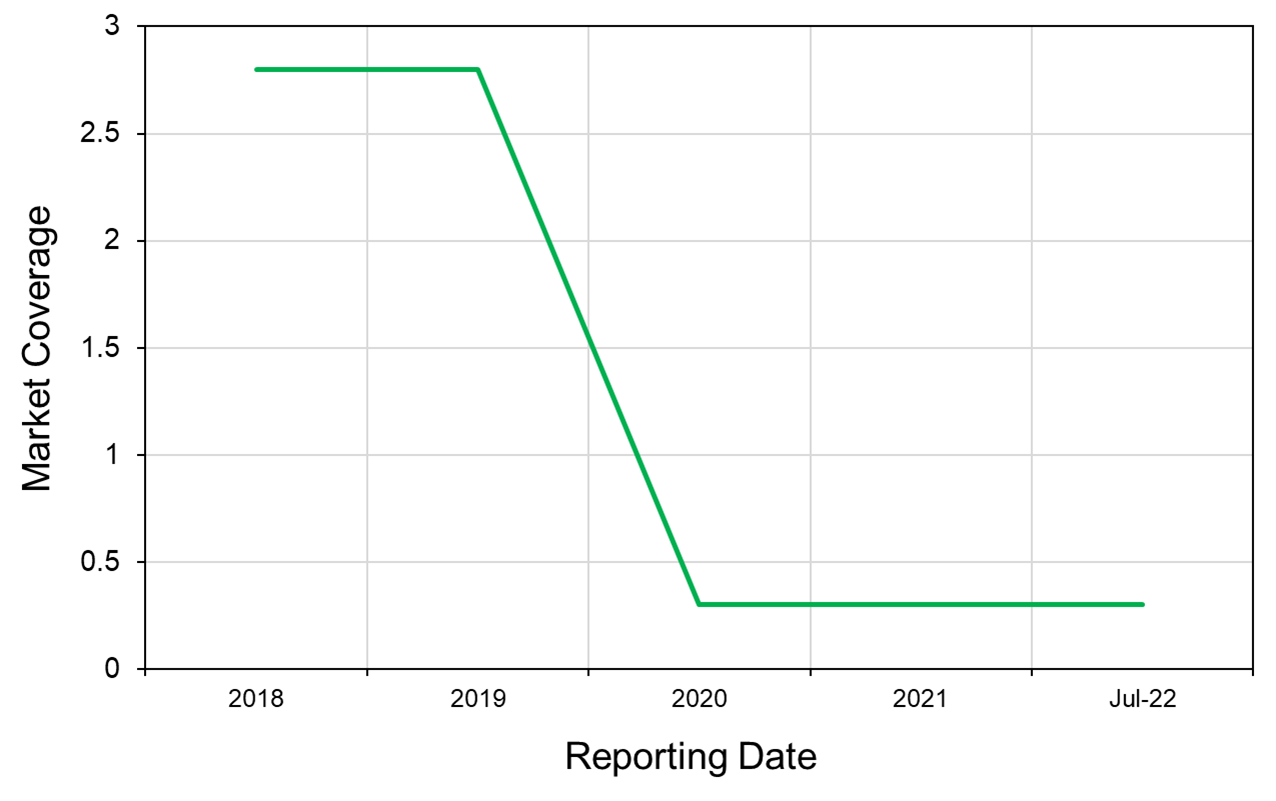
The current Market Coverage of a patent family that only includes a pending PCT application and no other active documents is 2.8 (as of July 2021).
Note: Once a PCT application enters the national phase, the legal status of the WO document is set to "inactive", while the in force documents related to the authorities in which the PCT application has been nationalized are set to "active". With that, the Market Coverage of the PCT application is replaced by the Market Coverage of these authorities in which the PCT application has been actually nationalized.
For many PCT applications, the entrance into the national phase thus results in a sudden drop in the Market Coverage as visualized in the chart below.
Why It Matters
Market Coverage lets you compare the true global reach of a patent family or portfolio, not just how many patents exist, but how much of the world's economic market they actually protect. This is especially useful for benchmarking international filing strategies against competitors, deciding where to expand protection, and understanding how a portfolio's global footprint changes as pending applications are granted or move through national phase.
Related Articles
Competitive Impact
Technology Relevance
The Patent Asset Index Methodology
Turning PatentSight+ Metrics into Business Insights